Build and develop the team.
I recruited the designers and trained them through enterprise project work, combining team leadership with direct involvement in discovery and design.
Over three years at Kearney, I recruited, trained, and led a design team across enterprise products. My role connected team development, product discovery, and a shared design system—giving designers a foundation for working through complex requirements together.
Explore the Benchmarking story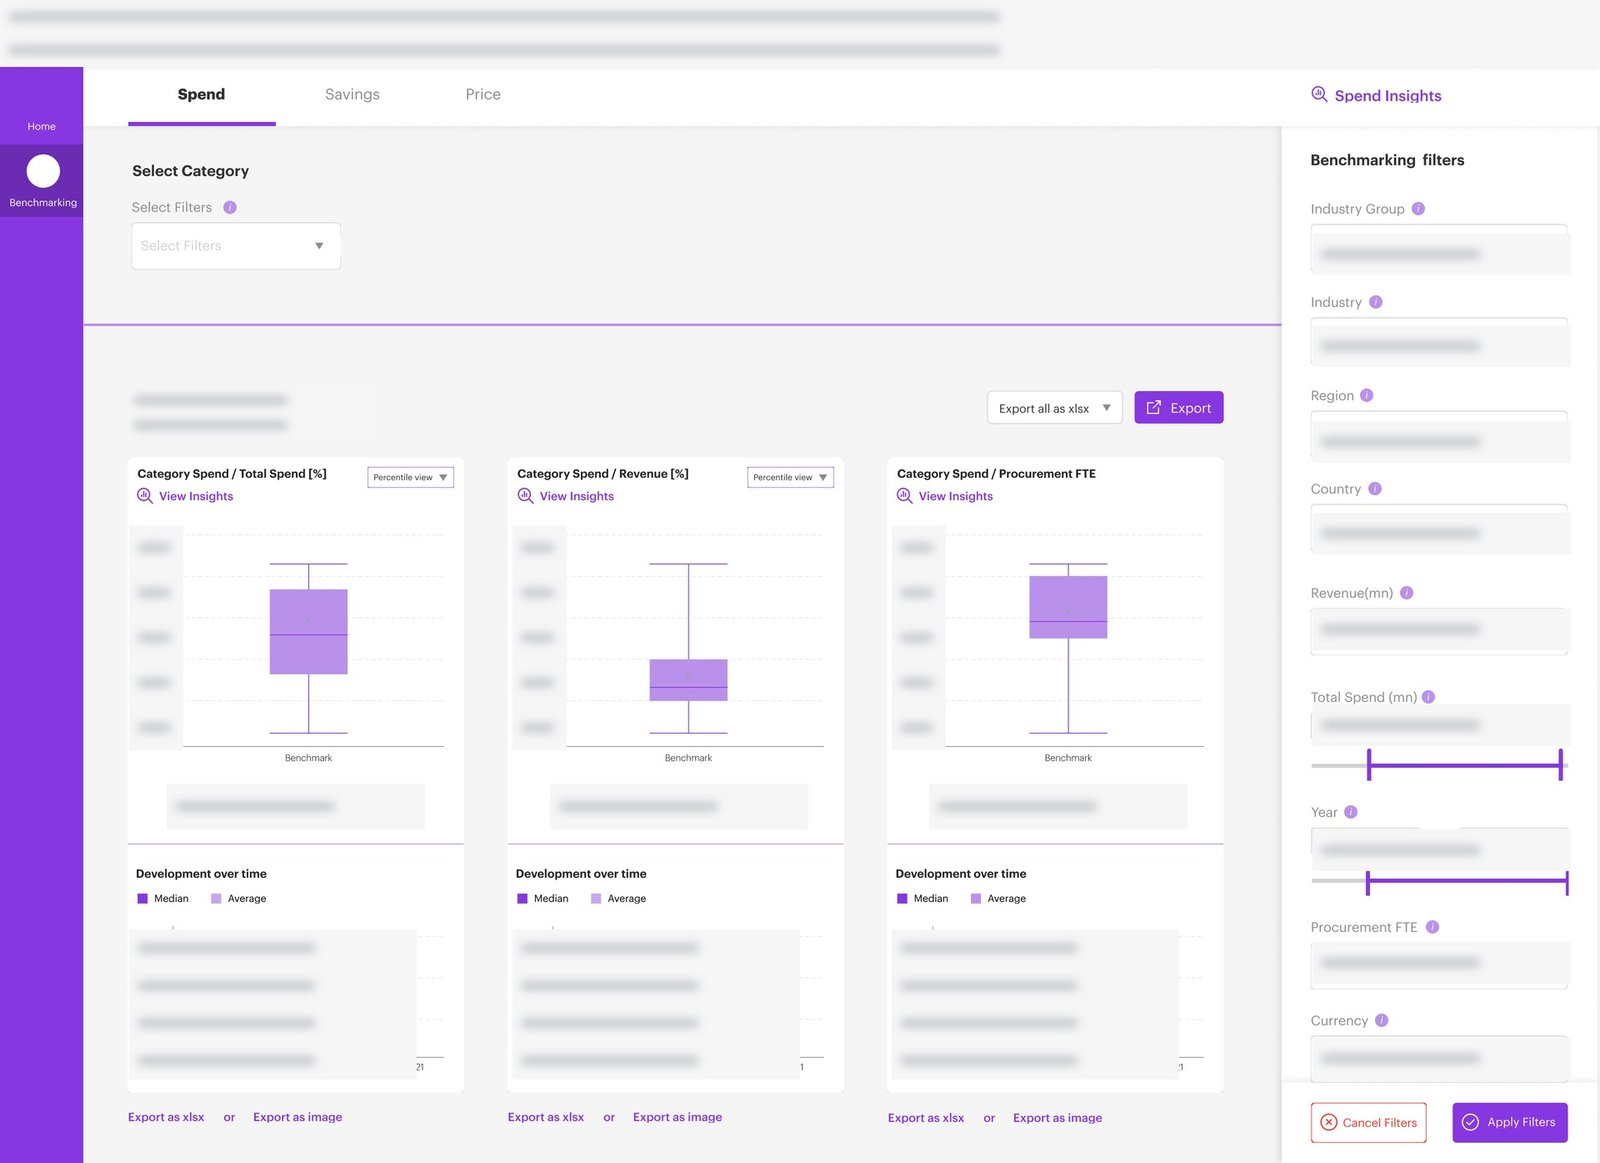
From data scattered across teams to information consultants can work with.
I built the team and helped establish how we approached enterprise product design.
As UX Design Manager, I handpicked designers from hundreds of résumés, trained them throughout my three-year tenure, and led their work across SAP, Power BI, Salesforce, and custom dashboards.
I connected that people leadership with hands-on product direction. On Benchmarking and Supplier Prism, I was involved from the beginning, bringing stakeholders and developers into discovery and helping the team turn fragmented requirements into a shared product structure.
I recruited the designers and trained them through enterprise project work, combining team leadership with direct involvement in discovery and design.
I facilitated workshops with business stakeholders, client participants, and developers so the team could work through role needs, requirements, and feasibility together.
I designed and developed Kearney Activate with the team, adding reusable components, tokens, and guidance as new projects introduced new needs.
Benchmarking brings my hands-on workshop practice, design management, and enterprise product work together. Supplier Prism extends that wider practice.
Spend, price, and savings comparisons for consultants.
02 / CONNECT INFORMATIONSupplier PrismSupplier discovery, evaluation, and collaborative updates.
Bring spend, price, and savings comparisons into one place.
Consultants needed to compare procurement spending, pricing, and savings. But collecting the information meant working across scattered sources and repeatedly going back to colleagues. Before we could make comparisons useful, we needed to understand how information would enter the product, who would prepare it, and who would review it.
Requirements arrived through presentations, PDFs, and conversations with different stakeholders. Those inputs described parts of the problem, but a collection of documents was not yet a product structure.
The product direction was already defined, but the documents did not give the design team a shared picture of the experience. I brought stakeholders into a workshop so we could question requirements together, make responsibilities visible through early wireframes, and identify what still needed an answer.
I conducted a three-day client workshop in Bangalore with Kearney colleagues and client participants who travelled from Mumbai. The first two days focused on discovery and project requirements. On day three, frontend and backend development leads joined us to discuss technical feasibility.
I framed the design around the responsibilities behind a comparison, rather than the charts alone. Consultants needed to explore benchmarks; other people needed to contribute, prepare, and review the underlying information. Mapping those responsibilities gave the team a structure for designing the connected experience.
The resulting interfaces distinguish four roles: consultants, power users, administrators, and subject-matter experts. The screens below show how those responsibilities translated into comparison tools, data contribution, coordination, and review.
I brought Kearney colleagues and client participants from Mumbai together in Bangalore. I structured the workshop to connect requirements with implementation before the team moved further into detailed design.
I facilitated questions about how consultants found information, what each role needed to do, and how comparisons would support their work. We used those answers to connect requirements, role needs, and early experience ideas.
Frontend and backend development leads joined us to discuss technical feasibility. This brought implementation constraints and open questions into the conversation before the team moved further into detailed interface design.
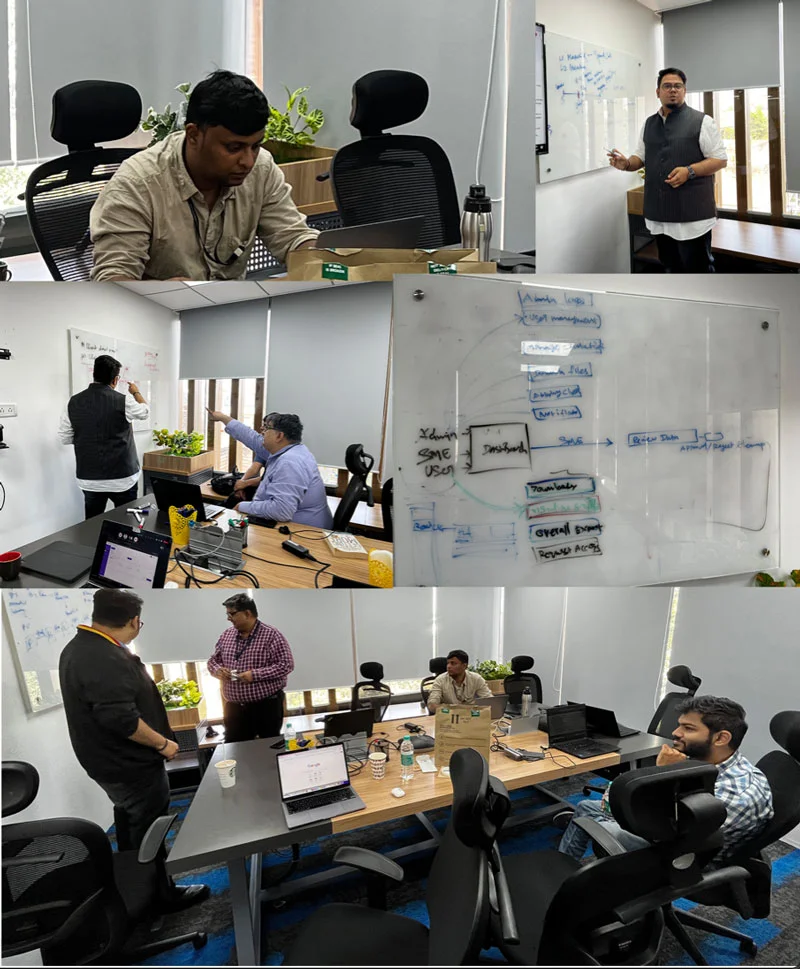
The tangible outcome was a product structure across four roles, supported by interface designs that made each responsibility visible.
Workshop discussion and early visual thinking connected scattered inputs to role needs and product structure, giving stakeholders and designers a common reference.
Frontend and backend leads joined on day three to discuss constraints and open questions before detailed interface design progressed further.
The design covered comparison, contribution, administration, and expert review. The dashboard became one part of a wider experience.
My contribution was to connect people, requirements, and design decisions while developing the team. The workshop and screens evidence that work; they do not establish adoption, time savings, or commercial results.
Explore the interfaces for comparison, contribution, administration, and expert review.
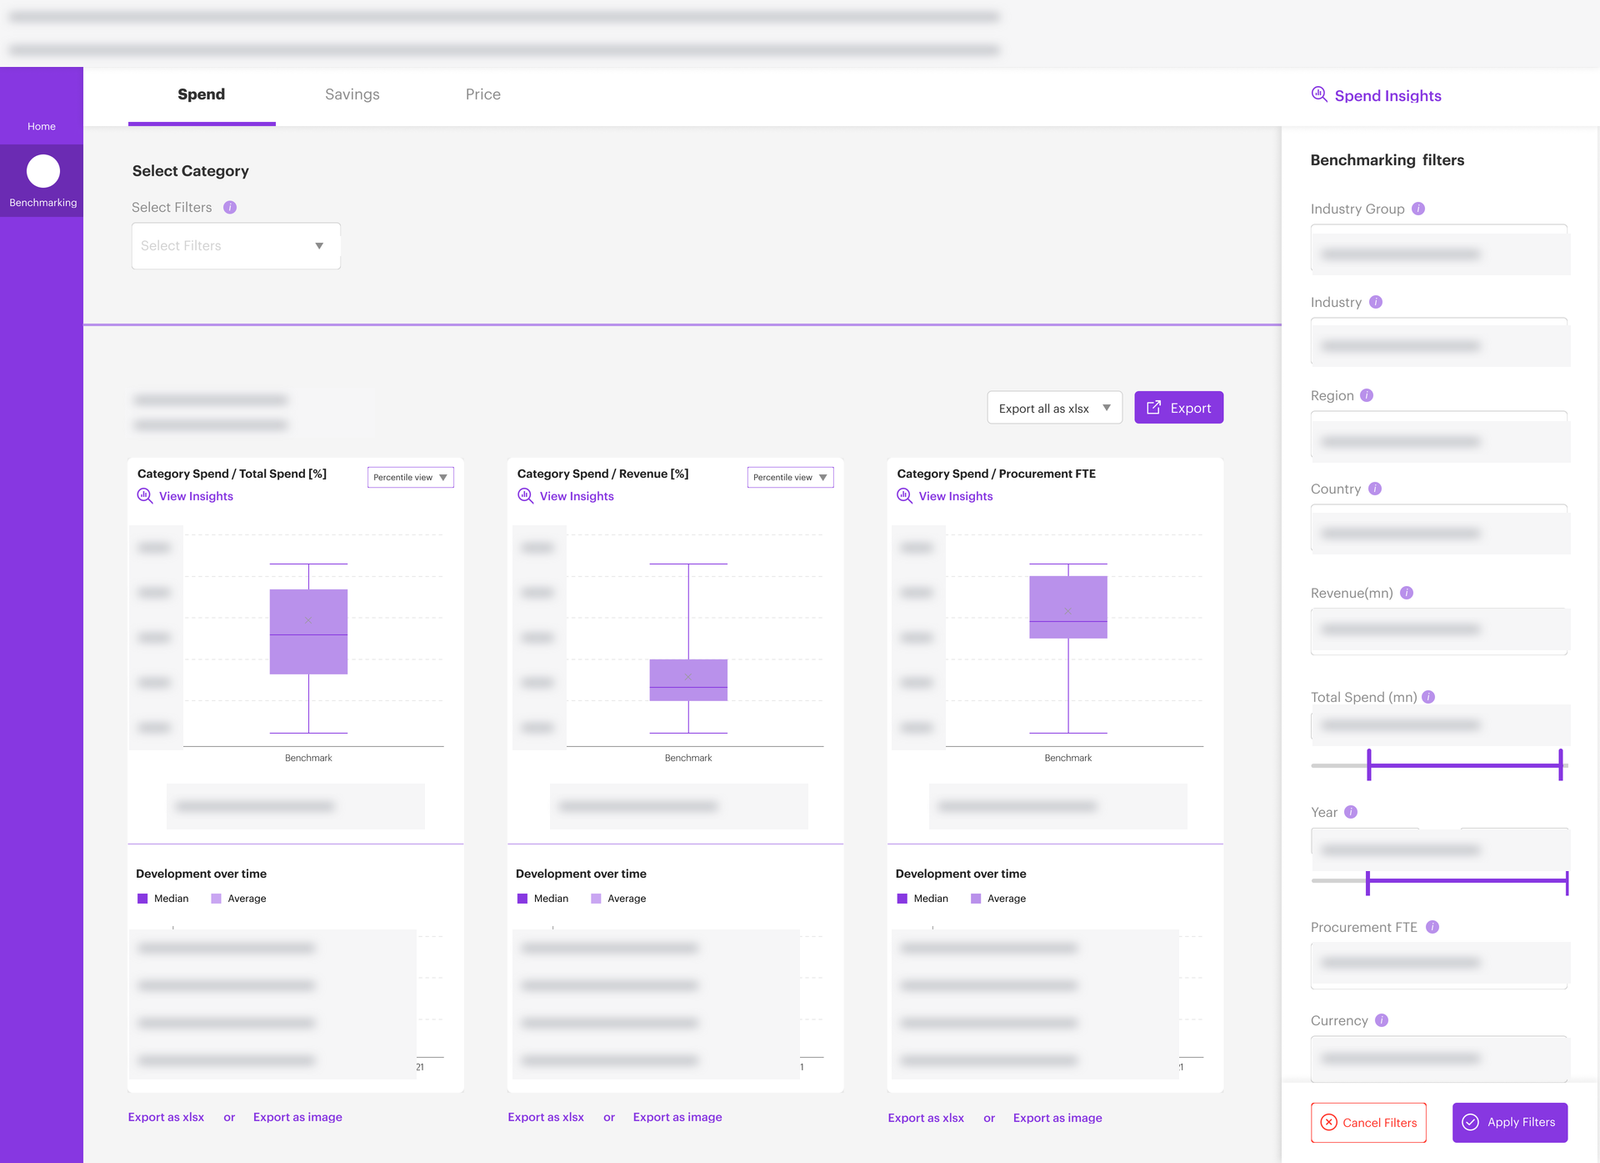
Compare spend and explore benchmarks.
Portfolio copies · Headers, identifying details, and sensitive data obscured.
Give supplier information a shared home.
Consultants lacked a central place to discover and compare suppliers. Supplier Prism aimed to help them find relevant suppliers, build shortlists, compare information, and take that information into their work.
I combined design management with hands-on facilitation from the beginning. With client-side participants and frontend colleagues, I worked through the proposed experience and the questions it raised. The workshop moved from the problem statement into discovery, role needs, and a shared view of the experience.
The workshop connected two sides of the product: helping consultants discover and compare suppliers, and helping the people maintaining the information respond when something needed updating. That made information quality part of the experience discussion, alongside search and comparison.
Discovery brought search, shortlisting, comparison, and information updates into one connected discussion. My management role was to help the team work from that shared understanding, while staying close to the hands-on design work.
Workshop records inform this account of the design process. Internal documents, participant details, and confidential operational specifics are not reproduced. These artifacts show how the work was framed; they do not establish measured business outcomes.
A shared design system I designed and developed with the team as new projects introduced new needs.
Each new project added to the system. Each addition became something the next project could build on.
Repeated component creation across Kearney products prompted a reusable system. We continually added components, design tokens, colour, and guidance as the work evolved.
During remote working, we moved from Sketch and InVision to Figma. I partnered with a frontend colleague to connect the design library with tokens, CSS classes, and code snippets.
Colour, typography, and tokens established a shared starting point.
New project requirements became new components and additions to the library.
Implementation guidance helped designers and developers work from the same system.
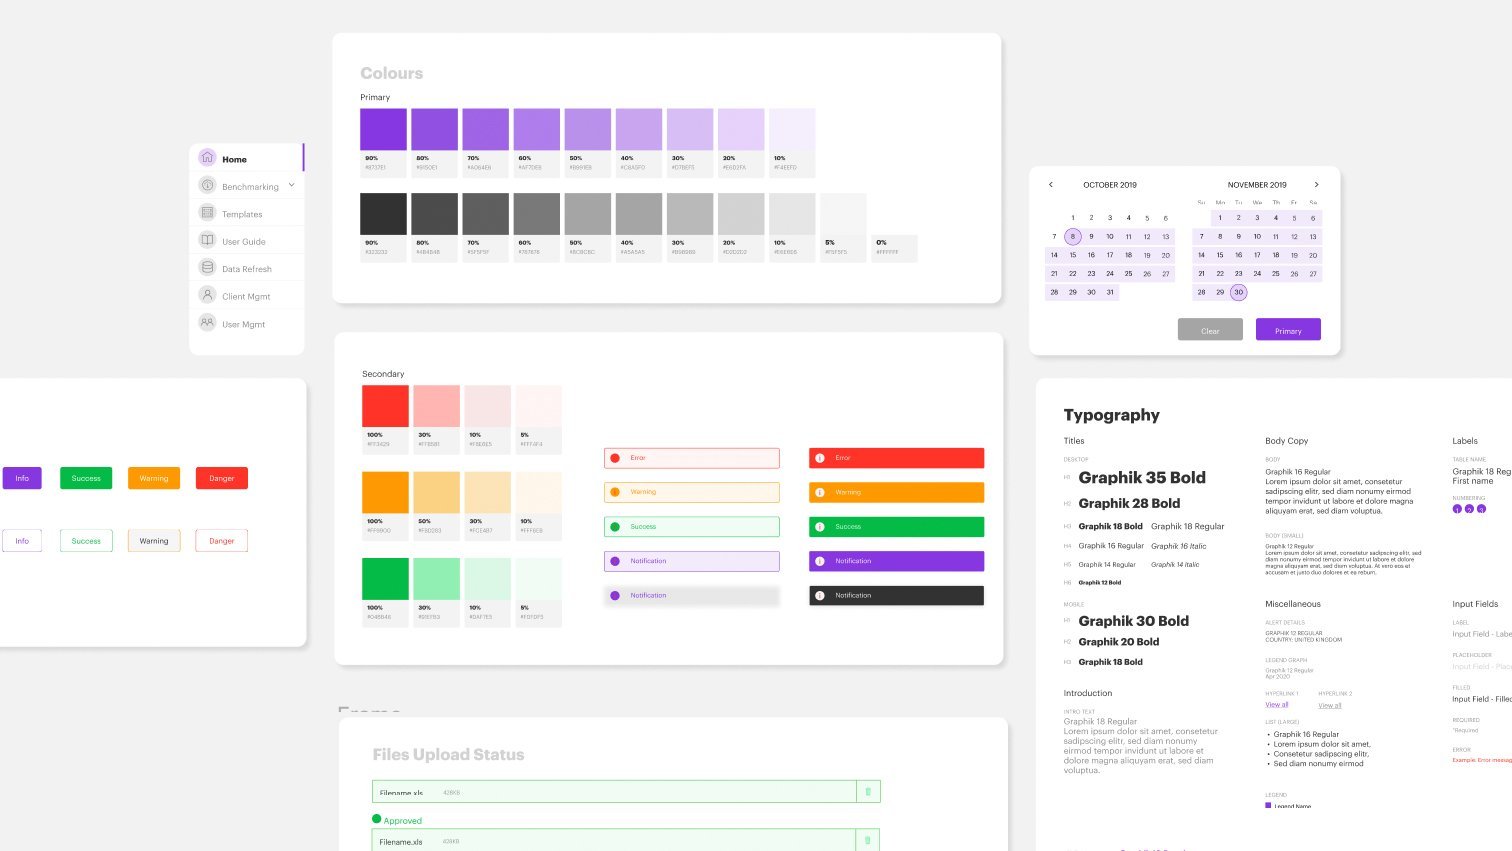 FOUNDATIONS / COLOUR, TYPE & STATES
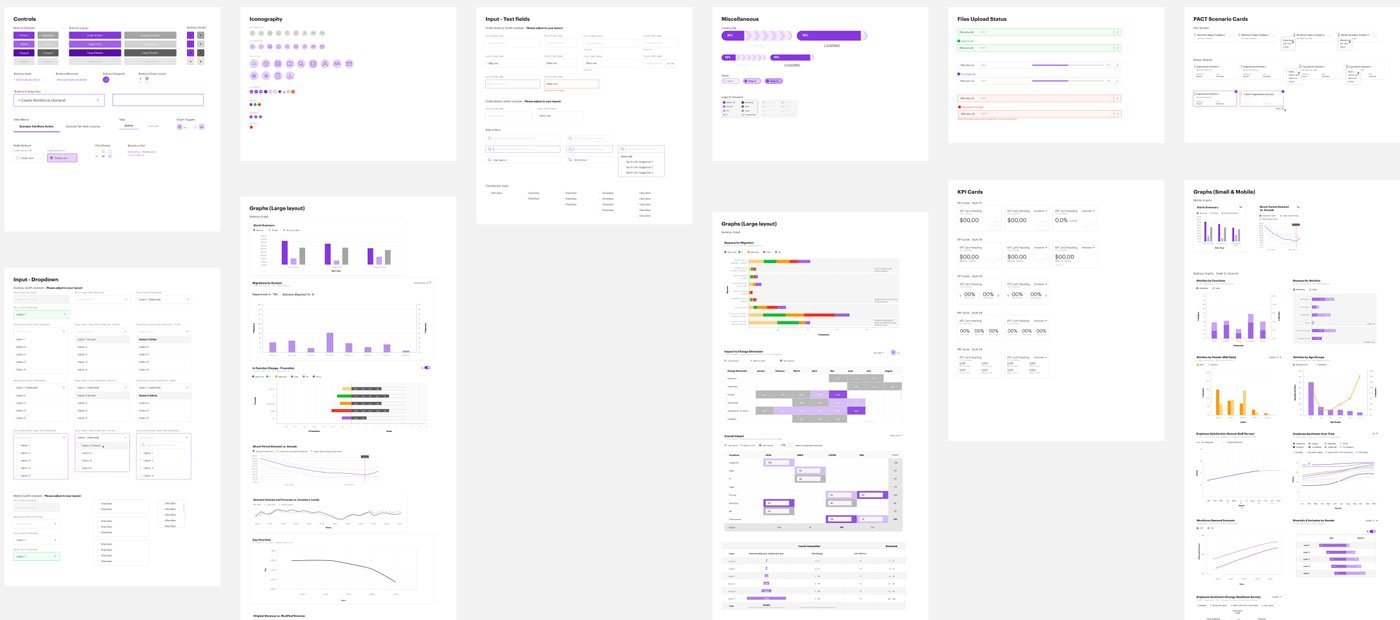 COMPONENTS / CONTROLS, CHARTS & PATTERNS
The value was in maintaining a shared foundation while giving each product room to grow.
Beyond the client projects: a reusable resource I created for designers working with Power BI.
I created and published a Power BI chart kit on Figma Community to support dashboard prototyping and the visual consistency of analytics experiences.
It brings chart patterns together in a reusable design resource, helping designers explore data experiences without starting each chart from scratch.
Counts displayed by Figma Community · 20 October 2026
Explore my Power BI chart kit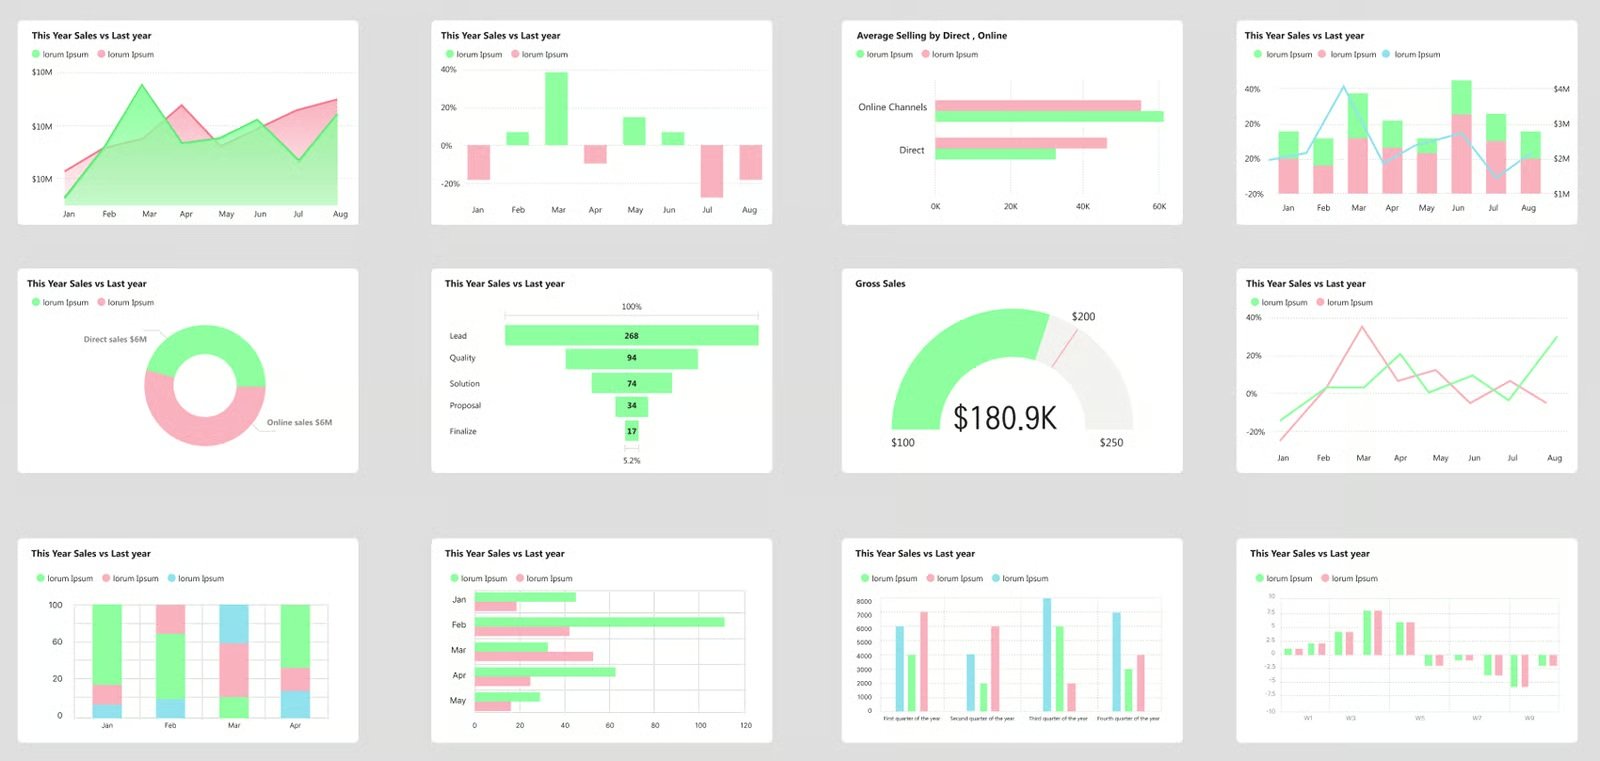
My Power BI work spanned fintech, insurance, and large-data applications. Its constraints called for an approach tailored to the platform.
The team supported designs for SAP, Power BI, Salesforce, and custom dashboards.
Our client work included organizations across banking, technology, aviation, mining, investment management, retirement services, and life sciences.









Clients listed reflect work during my tenure; they are not assigned to individual projects in this collection.
My contribution at Kearney spanned the people doing the work, the direction of the products, and the system connecting them. I recruited and developed designers, stayed close to discovery, and helped build a reusable foundation that evolved with the team’s projects.
Let’s discuss the decisions behind the work ← BACK TO SELECTED WORK